Advantage
Efficient Maintenance Dashboard
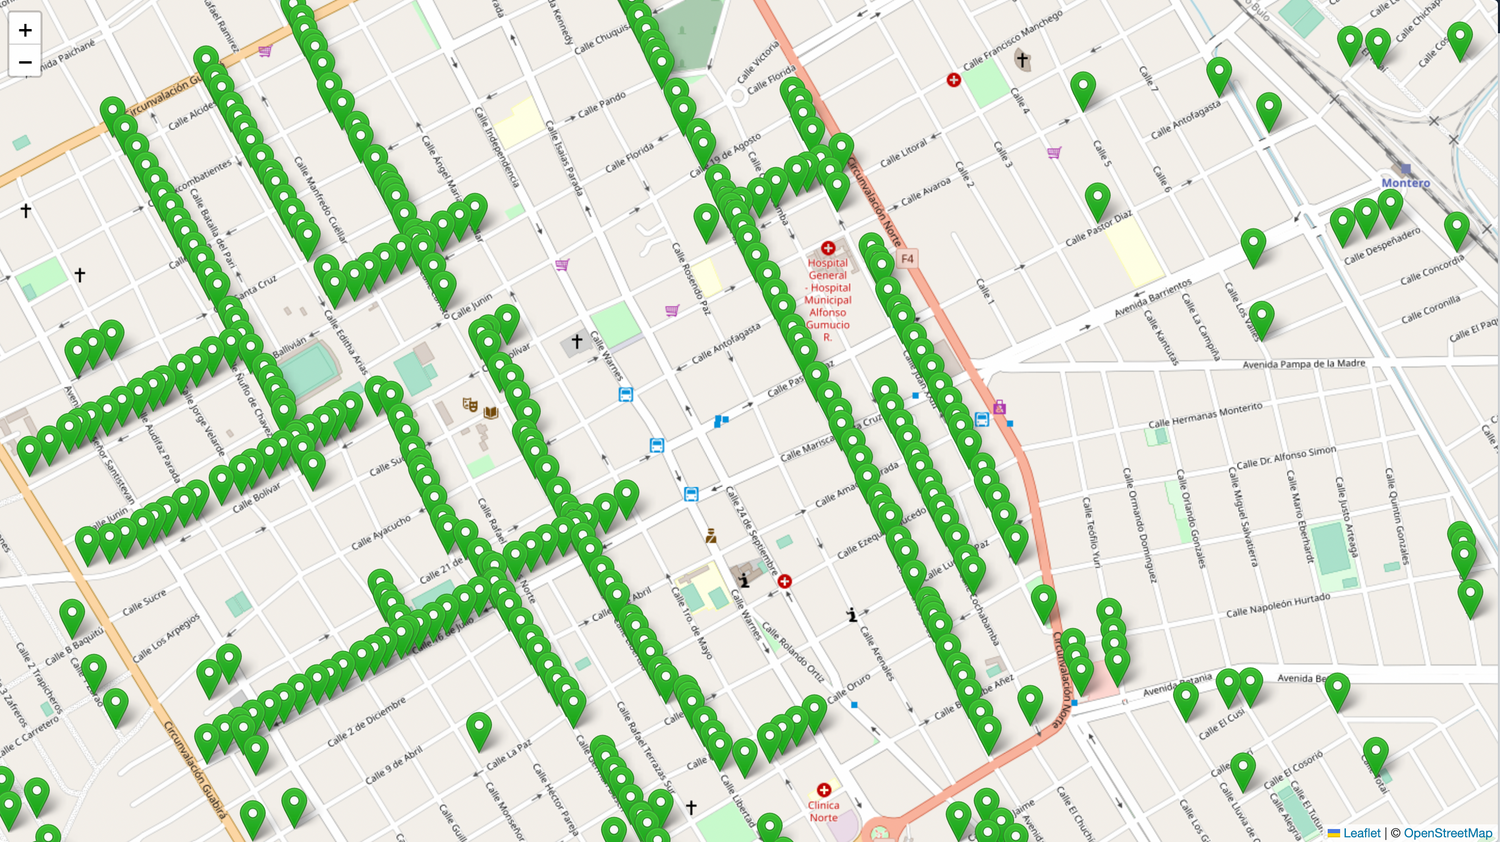
GeoTagIQ displays all street lighting poles on a map, color-coded to indicate whether the associated lamps are functioning correctly, require maintenance, or have failed. This provides an at-a-glance view of the status of each street lighting pole, allowing maintenance teams to prioritize their work efficiently. Additionally, supervisors can use the map display to monitor the progress of maintenance work across the city.
The management dashboard features a color-coded map that offers a comprehensive, real-time overview of the status of street lighting poles. This visual representation enables maintenance teams and supervisors to quickly assess which lamps are operational, which need maintenance, and which have failed. By facilitating efficient task prioritization and progress monitoring, the dashboard helps streamline maintenance operations and ensure timely responses to issues.
Advantage
Comprehensive Maintenance Overview
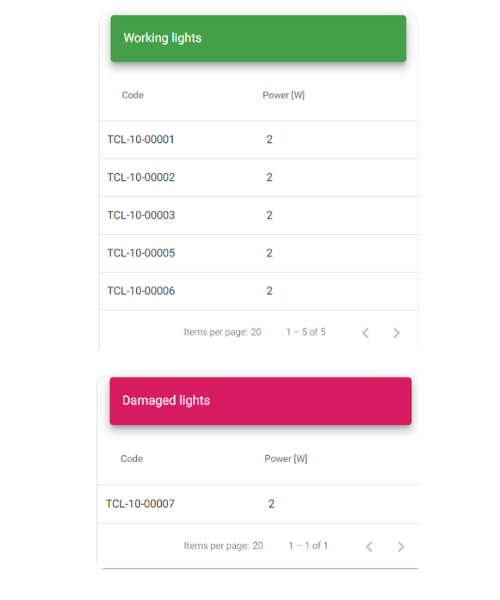
GeoTagIQ allows users to have an overview of all maintenance activities carried out by their team from any computer without needing to download any additional application. This centralized platform provides easy access to complete maintenance records, enhancing convenience and management efficiency.
The management dashboard provides a user-friendly approach to tracking and managing maintenance activities. By offering a centralized view of all activities without requiring extra software installations, it simplifies the management process. This accessibility ensures that maintenance records are always up-to-date and readily available, supporting efficient tracking and decision-making.
Description
Detailed Reports and Consumption Tracking
GeoTagIQ generates comprehensive maintenance reports per pole, including details on all maintenance activities, costs, and time required for each task. Additionally, it tracks global energy consumption on a monthly and yearly basis, enabling cities to monitor and optimize their street lighting systems.
The management dashboard’s capability to produce detailed maintenance reports and track energy consumption provides valuable insights for system optimization. By presenting clear data on maintenance costs, time expenditures, and energy use, it supports data-driven decision-making. This detailed reporting helps cities manage their resources more effectively and improve overall system efficiency.